
 By
By
| CONTRACT | CLOSE | NET CHANGE |
|---|---|---|
| Sep '26 Corn | 491 1/2 | +7 3/4 |
| Dec '26 Corn | 515 1/2 | +7 |
| Sep '26 Beans | 1216 | -9 |
| Nov '26 Beans | 1224 1/4 | -15 1/4 |
| Sep '26 Chi Wheat | 681 3/4 | +1/4 |
| Sep '26 KC Wheat | 750 1/2 | -5 3/4 |
| Dec '26 Cotton | 88.83 | +.48 |
| Crude Oil (spot futures) | 85.18 | -1.88 |
| US Dollar Index (spot futures) | 98.94 | +.21 |
| Dow Jones (spot futures) | 53,484 | +131 |
Daily Glance
Corn added to recent gains, thanks to the surprisingly low Pro Farmer corn yield estimate, while the tour's bearish soybean yield estimate ultimately pressured soybeans. Wheat followed corn higher initially, and also benefited from continued export infrastructure bombing in the Black Sea, but couldn't hold gains and ended virtually unchanged.
Want the rest of today's comment?
Leave your name and email to read the full daily market comment, including technicals, weather and trade implications.
Corn opened sharply higher last night, with the spillover strength actually pulling September beans up to a slight gain (although November topped out at unchanged), but the day session saw selling emerge across the board as traders appeared to want to capitalize on recent gains.
Outside markets featured mixed stock market action and a firm Dollar Index. Crude oil was lower, partly due to reports that oil tankers bound for China were allowed to pass through the Strait of Hormuz. This seems to provide a strong indication that it is in fact Iran that controls the Strait, not the US, despite President Trump's assertions to the contrary.
Key Points/Developments
Technicals: Dec corn's technical picture continued to strengthen today as it pushed up to new contract highs, and an 18 month high on the monthly continuous chart. However, late selling pulled prices down about 9 cents from session highs, lessening the strength of the overall picture. The gap from last night remains intact ( 509-510) and we now see that level as an important pivot point on a closing basis going forward. Support should be seen at 510-512, then the 506 area we had initially been watching as resistance, then 500. Resistance should be seen at today's highs near 524 and then 528-530 and then 545.
Nov beans should find support at 1218-1220, then 1210-1212, and 1200. Resistance is seen at 1230, 1238-1240, and 1250.
Spreads: The Sep/Dec corn spread narrowed fractionally to end at 24 cents. We find it pretty amazing that that spread has been unable to tighten at all while flat price has seen a 60+ cent rally inside of two weeks. The anticipated harvest pressure is likely the main reason it hasn't been able to tighten. On the other hand, the December 26/July 27 spread has narrowed from a recent peak of 30 3/4 to today's close at 22 (actually traded as narrow as 20 today when corn was trading at session highs) as the trade is pricing in the very real possibility of a much lower carryover figure than had recently been expected. This spread is likely to have a high correlation with flat price changes as the market grapples with the ongoing yield uncertainty.
The Sep/Nov bean spread continued to narrow today by 6 1/4 cents, settllng at 8 1/4, which seems a bit illogical considering that beans declined on the perception that we will have more beans than recently expected. On the other hand, the new crop carrying charge spread, November 26/July 27, widened by 3 3/4 cents to end at 30 1/2. That has been a wild spread, trading as wide as 41 3/4 on June 16, then tightening to only 13 cents on July 24, then back out to 39 on August 11, and now closing at 30 1/2. Like the corn carrying charge spread, this spread will likely correlate positively with yield and carryover projections.
Weather: TStorm left its ratings unchanged again today, corn, soybeans, and winter wheat all still neutral. Temps are expected to heat up again next week, as described in TStorm's closing comments today:
Seasonable to cool weather continue through Friday, followed by sharp warming from west to east as another very warm to hot period begins as upper-level high pressure re-assembles -- warmest in / near the Plains and mid-South, and despite a cool front that moves through the Corn Belt around next Tuesday (Sep. 1). At some point the high will probably break down 10 to 15 days out, but using the more conservative 00Z European output (00Z GFS is warmer) still shows that the 30 days ending Sep. 7 would be among the warmest of the last 50 years for U.S. corn and soybeans.
Some t-storms form along the western edge of coolness through Friday, followed by scattered t-storms deeper into the Corn Belt with time (starting this weekend) as heat expands and some energy follows, though a very wet period similar to early- and mid-August is not anticipated.
Markets/Trading Implications
Today's price action clearly shows how sensitive the market is to changes in yield expectations, which makes sense considering how the carryover projections have narrowed over the last several months, especially for corn. The yield uncertainty is extremely high and still very much a work in progress for both corn and soybeans. The range of corn yield estimates is an extreme when you consider that the Pro Farmer figure estimate is 173.3 while barely two weeks ago Stone X put in the highest estimate we've seen, 184.8. The price ramifications between these two extremes is huge, and the market will remain extremely sensitive to future field testing and estimates. Soybeans' estimates are in a much narrower range, with Pro Farmer at the high end of recent estimates, 53.3, while YieldCast is near the lowest we've seen at 52.1. Those seem like minor differences, but with the soybean carryover implying a stocks to usage ratio of just 7.0% per the USDA (corn's is at 10.1%), small changes in expectations could cause some relatively large price swings.
Given this increased sensitivity and the looming Washington summit with China (September 24), by which we feel there is a good chance of continued steady soybean buying by China if not an actual removal of their 10% grain import tariff, not to mention continued possible weather challenges, we remain content to hold off on additional new crop sales for now.
Other Notes
- The EPA's recent extension of their deadline for biodiesel regulation compliance continued to hit the soybean oil market hard, with the December contract dropping 2.27 cents per pound today (3.3%).
- There were rumors today that Zelensky offered some kind of ceasefire negotiation to Putin today, but this appeared to be rebuffed by Putin and the bombing of Black Sea grain export infrastructure continued through the weekend and today.
- Weekly export inspections were routinely soft today, and no new flash sales announced.
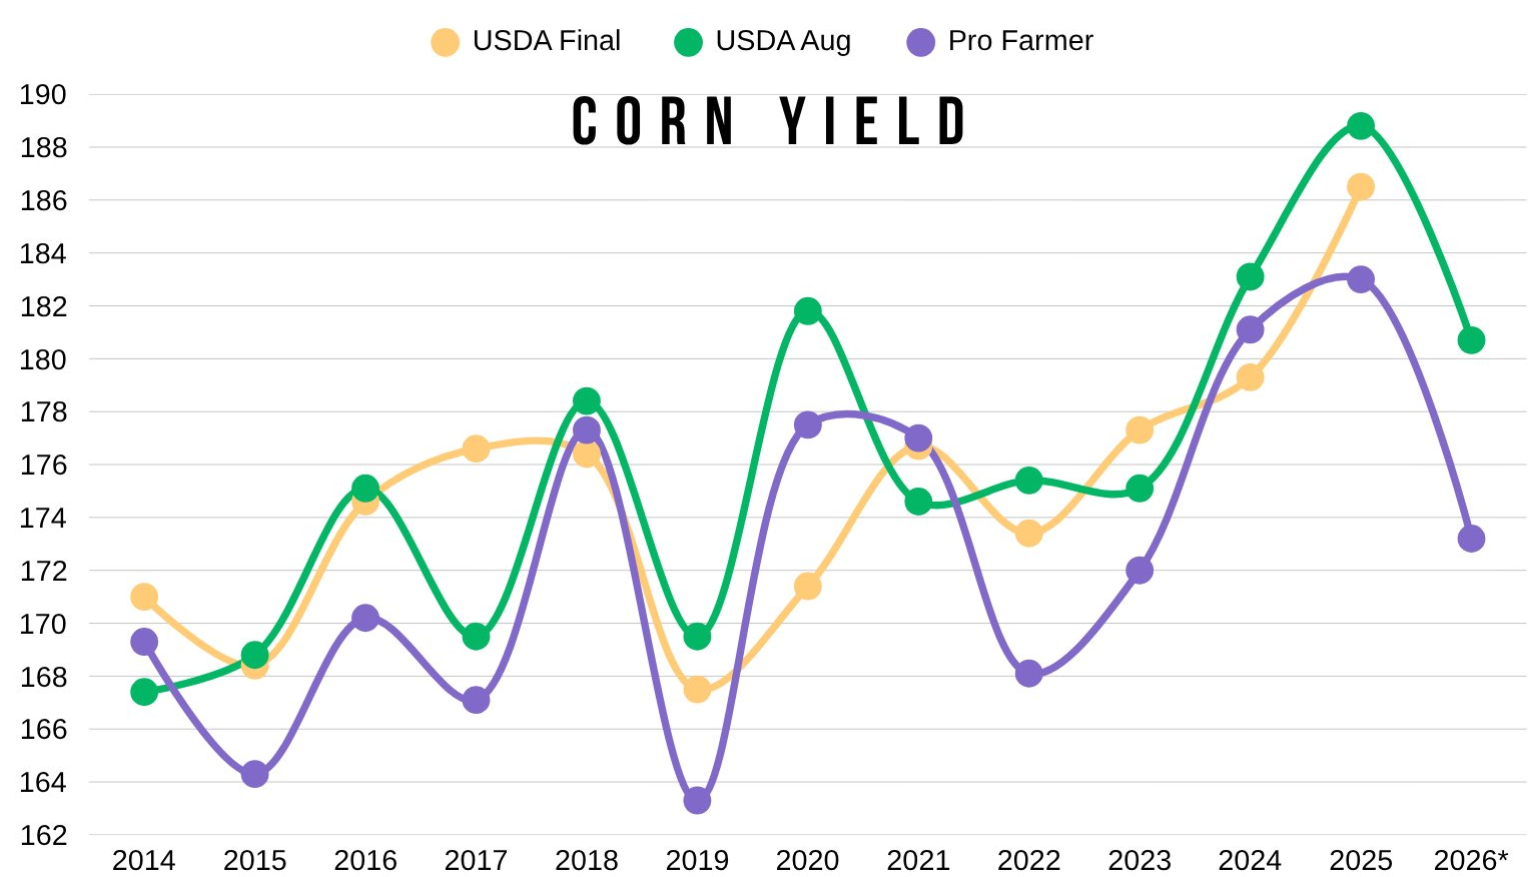
- Here is an interesting look at the history of how Pro Farmer corn estimates have compared to the August and final USDA estimates. Friday's estimate was the largest difference from the August USDA estimate in over ten years. Each time the PF estimate has come in at least 5 bpa less than the August USDA, the final USDA number has been lower than their August estimate, however, in those years, the USDA final has not dipped below the PF estimate.
Static Notes
- Commitment of Traders report released Friday, August 21 , covering positions through Tuesday, August 18, showed funds piling on even more length across the board. Corn's net long jumped to about 182,000 contracts, up roughly 56,000 on the week, funds buying about 9,000 new longs and covering another 47,000 of shorts. Soybeans saw a similar swing, net long growing to about 152,000, up 43,000, while wheat's net short narrowed to about 25,000, a shift of roughly 8,000.
- That buying came right into a week that was already rallying hard, not against it. Over the reporting week itself Dec corn gained 27 1/2 cents, Nov beans gained 48 cents, and Chicago wheat gained 34 1/4 cents. In the three market days since Tuesday's cutoff, corn added another 20 1/2 cents, beans another 23 1/4, and wheat another 17, so the buying has not let up.
Have a nice evening!
Clayton and Taylor
RISK DISCLAIMER:
Trading in futures products entails significant risks of loss which must be understood prior to trading and may not be appropriate for all investors.
Please contact your account representative for more information on these risks. Past performance of actual trades or strategies cited herein is not necessarily indicative of future performance.